http://www.uncommondescent.com/intelligent-design/do-humans-influence-temperature-records/
Do humans influence temperature records?
DLH
Can
the methods of Intelligent Design be brought to bear to detect anthropogenic
influence in temperature records? Core to the climate debate is the danger of
catastrophic anthropogenic global warming. We hear of tipping
points promising coast lands drowning in glacial melt. Defining very likely
as > 90%, the IPCCs Climate Change 2007: Synthesis Report
holds that:
Most of the observed increase in global average temperatures since the mid-20th century is very likely due to the observed increase in anthropogenic GHG concentrations.
In The Smoking Gun At Darwin Zero Willis Eschenback examines temperature records at Darwin, North Australia. He looks
at what happens when the GHCN removes the in-homogeneities to adjust the data. Of the five raw datasets, the GHCN discards two, . . . The three remaining records are first homogenized and then averaged to give the GHCN Adjusted temperature record for Darwin.
To my great surprise, heres what I found. To explain the full effect, I am showing this with both datasets starting at the same point (rather than ending at the same point as they are often shown).
 Figure 7. GHCN homogeneity adjustments to Darwin
Airport combined record
Figure 7. GHCN homogeneity adjustments to Darwin
Airport combined record
YIKES! Before getting homogenized, temperatures in Darwin were falling at 0.7 Celcius per century but after the homogenization, they were warming at 1.2 Celcius per century. And the adjustment that they made was over two degrees per century when those guys adjust, they dont mess around. And the adjustment is an odd shape, with the adjustment first going stepwise, then climbing roughly to stop at 2.4C. . . .

Figure 8 Darwin Zero Homogeneity Adjustments. Black
line shows amount and timing of adjustments.
Yikes again, double yikes! What on earth justifies that adjustment? How can they do that? We have five different records covering Darwin from 1941 on. They all agree almost exactly. Why adjust them at all? Theyve just added a huge artificial totally imaginary trend to the last half of the raw data! Now it looks like the IPCC diagram in Figure 1, all right but a six degree per century trend? And in the shape of a regular stepped pyramid climbing to heaven? Whats up with that?
Those, dear friends, are the clumsy fingerprints of someone messing with the data Egyptian style they are indisputable evidence that the homogenized data has been changed to fit someones preconceptions about whether the earth is warming.. . .
And with the Latin saying Falsus in unum, falsus in omis (false in one, false in all) as our guide, until all of the station adjustments are examined, adjustments of CRU, GHCN, and GISS alike, we cant trust anyone using homogenized numbers. . . .
Do you agree with Eschenback in attributing to humans these differences in
reported temperatures? Can such adjustments be reliably distinguished from
natural variations such as those due to 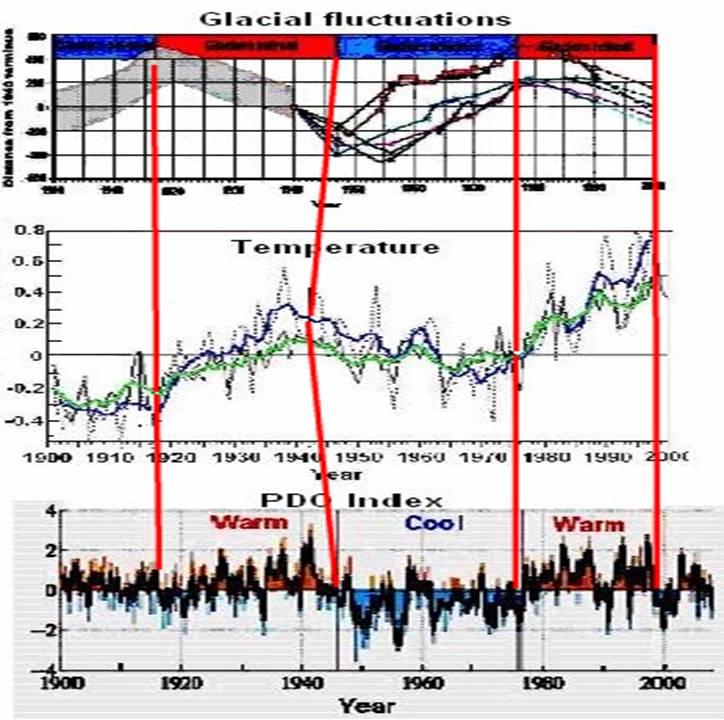 Figure 3 Glacial fluctuations, Temperature & PDO
See Easterbrook's presentations onglobal warming including his predictions of global cooling and warming . See also Matt Vooro on AMO and PDO- The Real Climate Makers In United States?
So what say you? Can anthropogenic influence be detected in temperature records or can these variations be considered as natural? Can such data be depended on to make public policy decisions for trillion dollar investments?
See Willis Eschenbacks full article: The Smoking Gun At Darwin Zero


